
The company released global midyear viewer data for every title on its service for the first time ever.
Netflix is finally ready to tell the world how many people watch its shows.
We watched over 92 billion hours or almost 11,000 years of TV on Netflix in the first half of 2023, and over 30% of Netflix’s most popular content has been released either this year or last. The top show by viewing hours was Netflix’s own The Night Agent at 812 million hours viewed, and the second-most-viewed, which I’ve never even heard of, was Ginney & Georgia season 2, at 665 million hours. And a staggering 18,129 shows on Netflix achieved over 50,000 hours of total viewing.
We know this because Netflix did something it has almost never done before yesterday: share specific viewing numbers on its most popular shows from the first half of this year. Not only did it share those numbers—and a lot of them—it even provided them in an Excel file, which is essentially inviting people to analyze the data for insights.
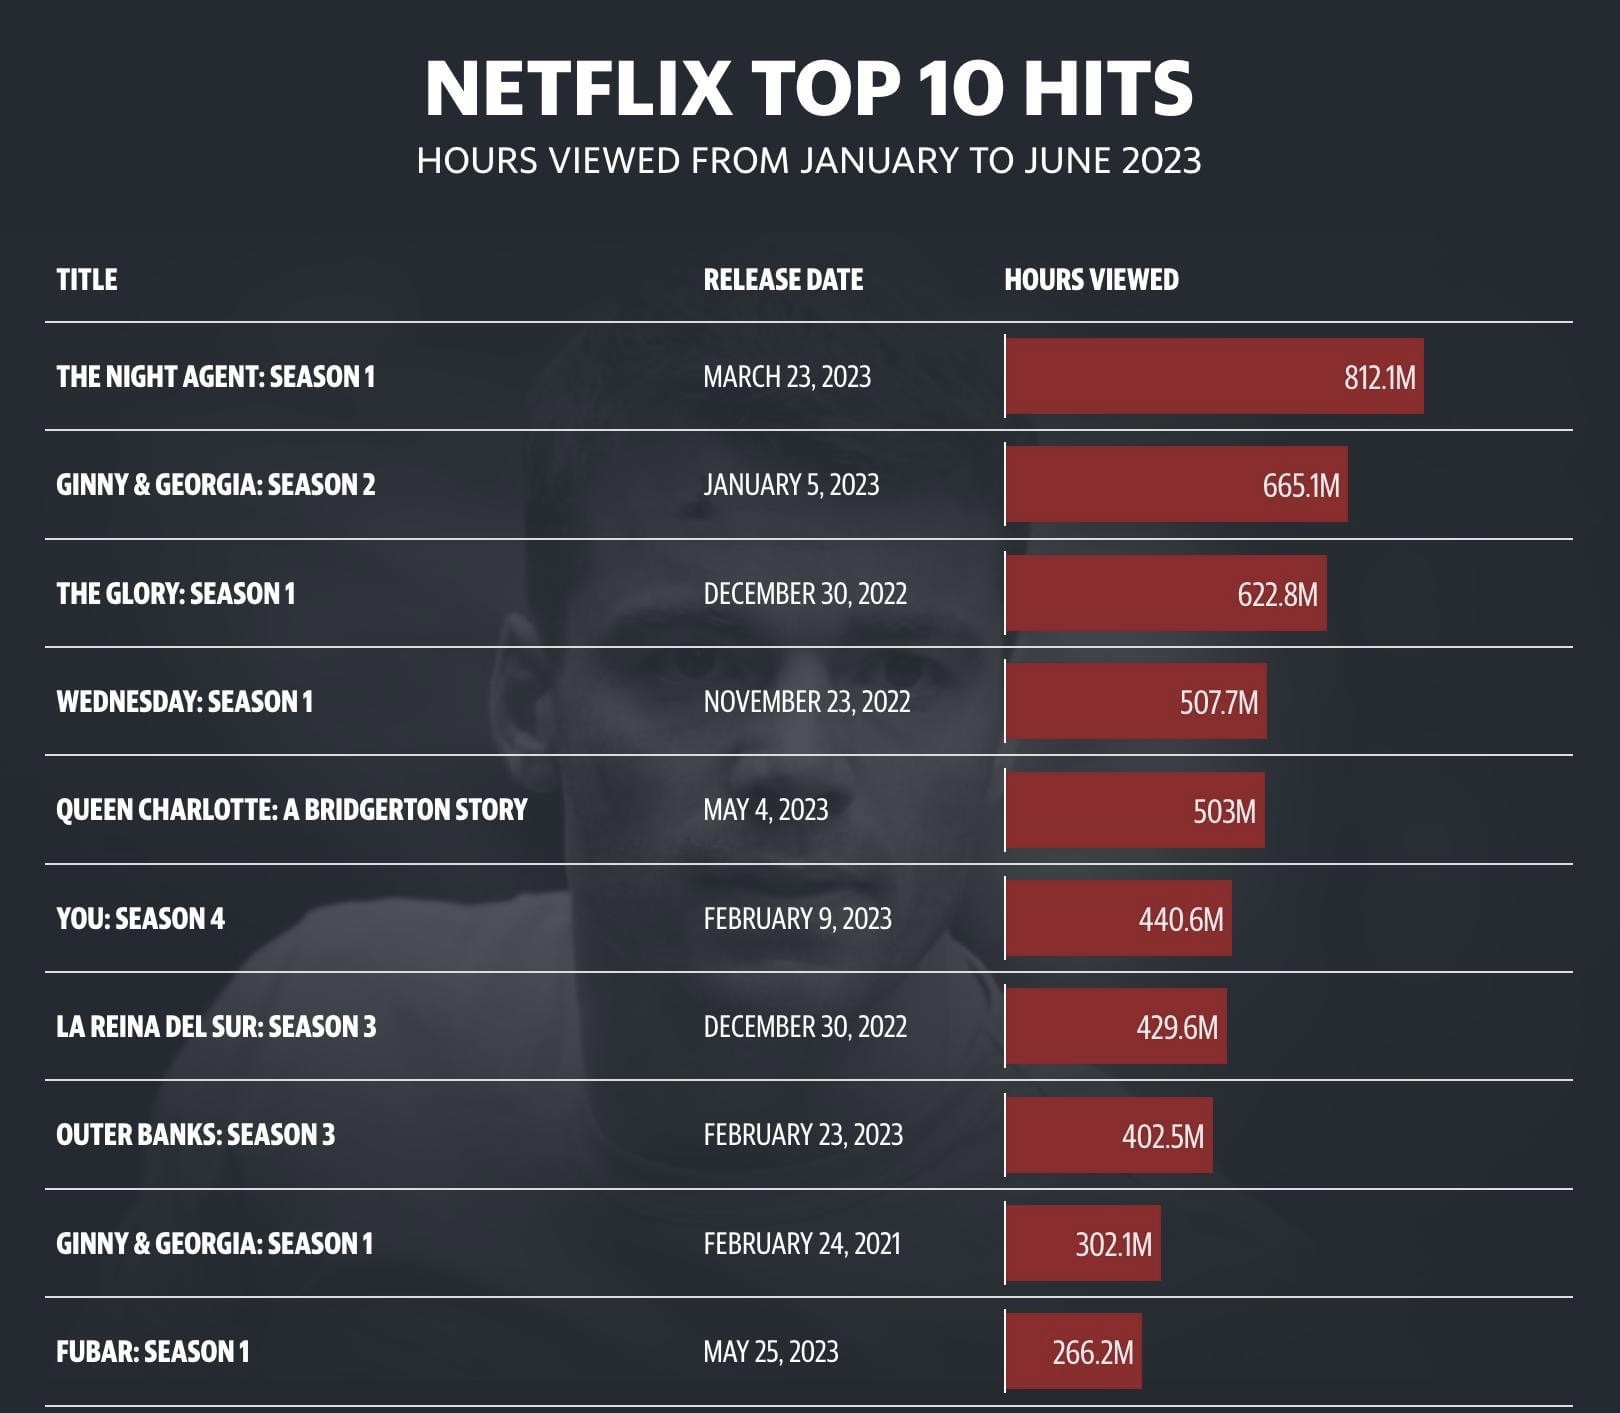
The top 10 most-viewed:
- The Night Agent: Season 1 (812 million hours)
- Ginny & Georgia: Season 2 (665 million hours)
- The Glory: Season 1 // 더 글로리: 시즌 1 (622 million hours)
- Wednesday: Season 1 (508 million hours)
- Queen Charlotte: A Bridgerton Story (503 million hours)
- You: Season 4 (441 million hours)
- La Reina del Sur: Season 3 (430 million hours)
- Outer Banks: Season 3 (403 million hours)
- Ginny & Georgia: Season 1 (302 million hours)
- FUBAR: Season 1 (266 million hours)
The most obvious point that is immediately visible: people watch a lot of Netflix. The total number of hours viewed for all the shows in Netflix’s document—which includes only shows watched more than 50,000 hours—is approximately 93,455,200,000 hours. This is equivalent to 3,893,966,667 days, 129,798,889 months, or 10,816,574 years. (Forbes)